




Turnaround time (TAT) is widely used as a performance indicator of timeliness and laboratory service efficiency. ¹ However, TAT is not a uniform measure and should be clearly defined according to the starting and ending points of the laboratory process being measured. ² Laboratory quality encompasses multiple dimensions, including accuracy, reliability, timeliness, and conformity with established requirements and user expectations. ³
Although timely delivery of laboratory results is important for decision-making and user satisfaction, shortening TAT should not be achieved by bypassing established procedures or quality requirements (QMS-Quality Management System). TAT is therefore most meaningful when interpreted alongside other laboratory quality indicators rather than as an isolated measure of performance. ¹, ³
The laboratory testing process comprises pre-analytical, analytical, and post-analytical phases. The pre-analytical phase includes activities such as test ordering, preparation, sample collection, identification, transportation, and receipt or processing of samples. The analytical phase involves preparation and testing, while the post-analytical phase includes result verification, interpretation, reporting, and communication of results. ⁴,⁵ Errors and delays can occur at any stage of this total testing process; consequently, monitoring TAT should consider the contribution of each phase rather than focusing exclusively on the analytical process. ⁴,⁵
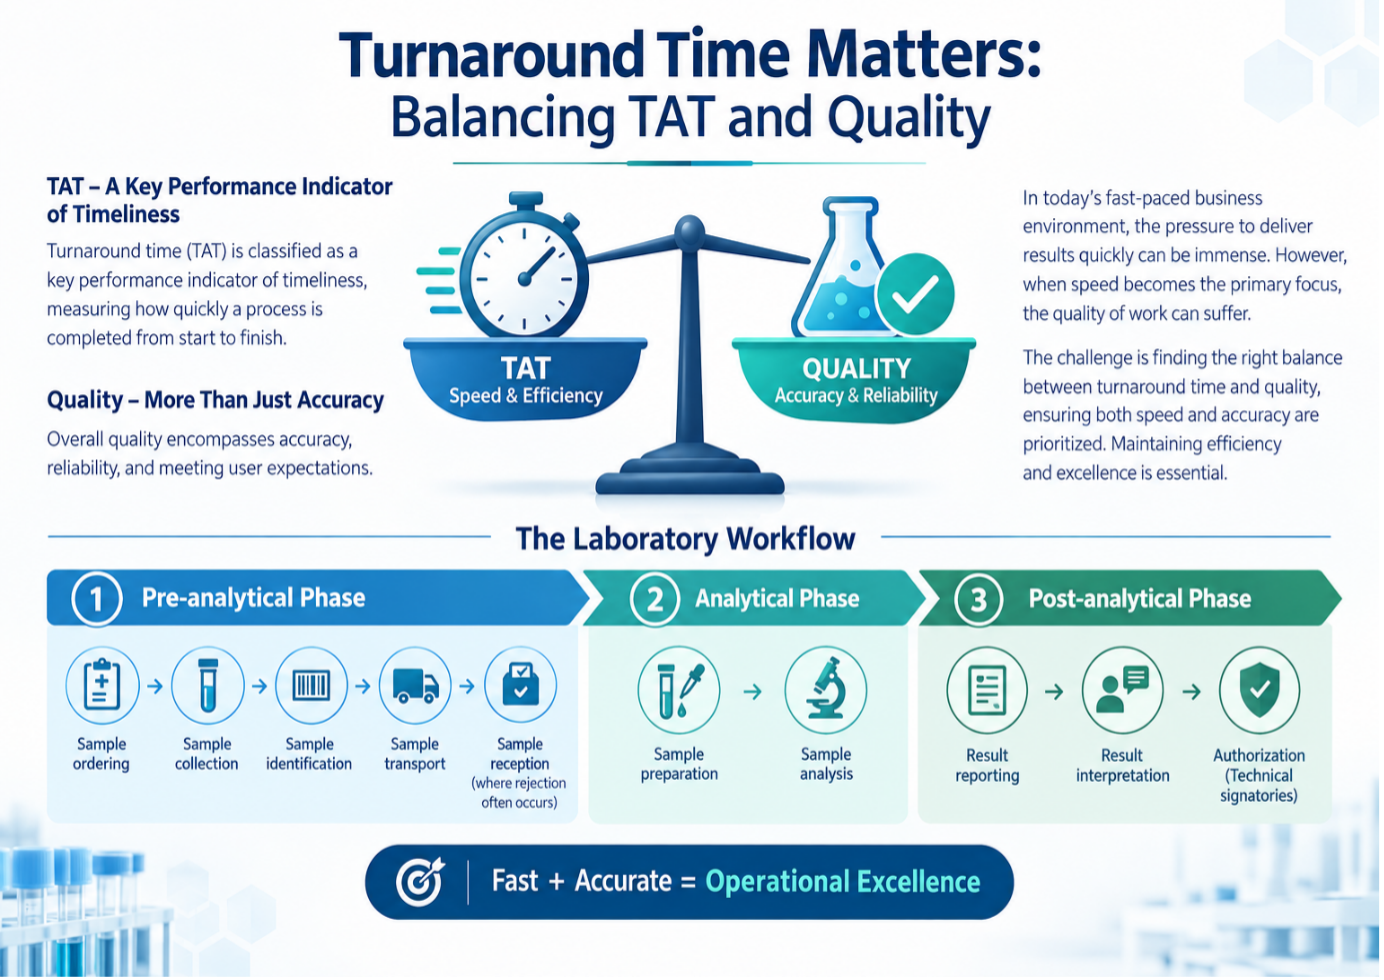
TAT vs Quality
| Feature | Turnaround Time (TAT) | Quality |
| Core focus | Timeliness, speed and process efficiency. | Accuracy, reliability, safety and conformity with requirements. |
| Definition | The elapsed time between defined points in a laboratory testing process, such as specimen receipt and result reporting, or another agreed start and end point. ² | The extent to which laboratory processes and services consistently meet defined requirements and intended purposes.³ |
| Measurement | Time-based measures, such as minutes, hours or days, according to the agreed TAT definition. ¹,² | Quality indicators such as error rates, specimen rejection rates, corrected reports, compliance measures and other indicators relevant to the testing process. ³,⁵ |
| Impact | Supports timely clinical decision-making and responsiveness to users. ¹ | Supports reliable clinical information, patient safety, confidence in laboratory services and effective clinical management. ³,⁵ |
| Risk of excessive focus | Excessive pressure to reduce TAT may encourage process shortcuts or failure to adequately address quality requirements. | Excessive or inefficient processes may introduce unnecessary delays and resource use; quality improvement should therefore also consider process efficiency. ⁶ |
Monitoring TAT as a Quality Indicator
Effective monitoring of TAT across the pre-analytical, analytical, and post-analytical phases provides laboratories with greater visibility of process performance and can assist in identifying delays, bottlenecks and recurrent sources of non-conformity. ¹,⁴,⁵
The frequency and level of TAT reporting are also important. Aggregated reporting over long periods may conceal variations in performance and individual periods of poor performance. (Coetzee et al.) demonstrated that weekly laboratory TAT monitoring can identify performance problems that may be masked when results are aggregated over longer reporting periods. ⁷
TAT should therefore be monitored using clearly defined indicators, appropriate denominators and agreed performance targets. Different TAT definitions can produce substantially different results; consequently, laboratories should specify the beginning and end points of the TAT being measured to ensure that data are interpreted consistently and are suitable for comparison over time. ²
Quality Management and Continuous Improvement
Transparency of TAT performance across appropriate levels of the organisation can support accountability and facilitate proactive quality improvement. TAT data can be incorporated into the laboratory quality management system and reviewed together with other quality indicators to identify opportunities for improvement. ³,⁵
Root-cause analysis can assist in determining whether delays arise from pre-analytical, analytical, post-analytical, staffing, workflow, information-system or logistical factors. ⁴,⁶ Corrective actions should subsequently be implemented, monitored and evaluated for effectiveness.
Process-improvement methodologies such as Lean have also been investigated as approaches for reducing laboratory TAT by identifying and eliminating non-value-adding activities and workflow inefficiencies. A recent systematic review found that Lean interventions were associated with improvements in laboratory TAT and operational performance, although the magnitude of improvement varied between settings and interventions. ⁶
Conclusion – The Bottom Line
Balancing turnaround time with quality is a fundamental component of effective laboratory service delivery. Although timely reporting of laboratory results is essential to support decision-making and meet user expectations, reductions in TAT should not compromise the accuracy, reliability, safety or integrity of laboratory processes and results.
Effective monitoring of TAT across the pre-analytical, analytical and post-analytical phases provides laboratories with greater visibility of process performance and facilitates the identification of delays, bottlenecks and recurrent sources of non-conformity. ¹,⁴,⁵ Monitoring TAT at appropriate intervals and across relevant testing areas can also identify performance variations that may be obscured when data are reported only as aggregated measures.⁷
Transparency of TAT performance across the organisation supports accountability and enables a proactive approach to quality improvement. Regular review of TAT trends, together with other quality indicators, can assist laboratories in identifying areas requiring intervention and evaluating whether improvement measures have been effective. ³,⁷
The objective should therefore not be to prioritise TAT over quality, or quality over TAT, but to optimise laboratory processes so that timely service delivery is achieved without compromising quality requirements. Continuous monitoring of TAT alongside other quality indicators can support evidence-based decision-making, process improvement and the delivery of consistent and reliable laboratory services. ¹,³,⁶
In laboratory, operational excellence is achieved when timely results and quality results are delivered together. Fast enough to meet expectations. Accurate enough to maintain trust. Consistent enough to drive continuous improvement.
Reference:
- Hawkins RC. Laboratory turnaround time. Clin Biochem Rev. 2007;28(4):179-194. (PubMed Central (PMC))
- Breil B, Fritz F, Thiemann V, Dugas M. Mapping turnaround times (TAT) to a generic timeline: a systematic review of TAT definitions in clinical domains. BMC Med Inform Decis Mak. 2011;11:34. doi:10.1186/1472-6947-11-34. (PubMed Central (PMC))
- Shahangian S, Snyder SR. Laboratory medicine quality indicators: a review of the literature. Am J Clin Pathol. 2009;131(3):418-431. doi:10.1309/AJCPJF8JI4ZLDQUE. (ResearchGate)
- Plebani M, Sciacovelli L, Aita A, Chiozza ML. Quality indicators for laboratory processes. Clin Chem Lab Med. 2013;51(2):e1-e4.
- Sciacovelli L, Lippi G, Sumarac Z, et al. Quality indicators in laboratory medicine: the status of the progress of IFCC Working Group “Laboratory Errors and Patient Safety” project. Clin Chem Lab Med. 2017;55(3):348-357.
- Cherie N, Berta DM, Tamir M. Improving laboratory turnaround times in clinical settings: a systematic review of the impact of lean methodology application. PLoS One. 2024;19(10):e0312033. doi:10.1371/journal.pone.0312033. (PubMed Central (PMC))
- Coetzee L-M, Cassim N, Glencross DK. Weekly laboratory turn-around time identifies poor performance masked by aggregated reporting. Afr J Lab Med. 2020;9(1):a1102. doi:10.4102/ajlm.v9i1.1102.